nosetests: setup and teardown methods

nosetests is a tool used to build unit tests in python.

Here below, I show an example on how to write a class that will perform some tests (test that a directory that has been created exists indeed).

One issue is that if you create a temporary file or directly (as in the example), then you will end up with a bunch of useless files in your directory. So, you need to do some cleaning once the test methods have been called. This is done by writing a method with the special name tearDown. Similarly, you may need some kind of initialisation. This is done with the special method setUp.

import os, shutil
 
class TestClass:
   def setUp(self):
       os.mkdir("testDir")
 
   def tearDown(self):
       shutil.rmtree("testDir")
 
   def test_case_1(self):
       os.path.isdir("testDir") == True

One you have your test, you can check that the tests pass succesfully:

nosetests test_a.py -v
test_a.TestClass.test_case_1 ... ok
 
----------------------------------------------------------------------
Ran 1 test in 0.001s
 
OK
Posted in Python | Tagged , | Leave a comment

graphviz plot without graphviz…

Graphviz is a standard tools that is used to create images of graphs (see http://www.graphviz.org/). The graph are described thanks to a language. For instance the graph represented in the following image would be represented as

A -> B
B -> C
C -> A

Now, to transform the text above into an image, you would save the text in a file (let us say input.dot) and type:

dot -Tsvg input.dot -o output.svg

where dot is a binary provided by graphviz. If you do not have graphviz, you can use the nice API from google (which is used to create the image below) by typing:

<img src="https://chart.googleapis.com/chart?cht=gv:dot&amp;chl=digraph{ A [style=filled,fillcolor=forestgreen];  A->B[color=red, arrowhead=tee] ;  B->C->A}&amp;chs=350x350" alt="neato chart">

Posted in Computer Science | Tagged | Leave a comment

How to plot left and right axis with matplotlib

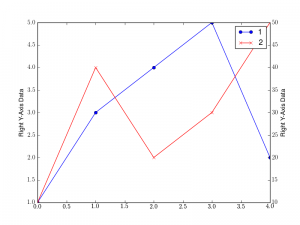
Sometimes, it is convenient to plot 2 data sets that have not the same range within the same plots. One will use the left y-axes and the other will use the right y-axis.

With matplotlib, you need to create subplots and share the xaxes. Here is a solution. This is not unique but seems to work with matplotlib 1.0.1

from pylab import figure, show, legend, ylabel
 
# create the general figure
fig1 = figure()
 
# and the first axes using subplot populated with data 
ax1 = fig1.add_subplot(111)
line1 = ax1.plot([1,3,4,5,2], 'o-')
ylabel("Left Y-Axis Data")
 
# now, the second axes that shares the x-axis with the ax1
ax2 = fig1.add_subplot(111, sharex=ax1, frameon=False)
line2 = ax2.plot([10,40,20,30,50], 'xr-')
ax2.yaxis.tick_right()
ax2.yaxis.set_label_position("right")
ylabel("Right Y-Axis Data")
 
# for the legend, remember that we used two different axes so, we need 
# to build the legend manually
legend((line1, line2), ("1", "2"))
show()

Posted in Python | Tagged , | 4 Comments

How to call R plotting function from python using rpy2

Python has already very good librairies from plotting (e.g., matplotlib, mayavi), however, it is sometimes useful to use some of the plotting functionalities offered by R. Thanks to the rp2 package, it is quite easy. Let us try to use the simple function plot and hist. We will use numpy to create the randon data to plot but you could use simple python

# import rpy2 robjects to call R code
import rpy2.robjects as robjects
 
# some aliases to R functions
rplot = robjects.r('plot')
rhist = robjects.r('hist')
 
# some random data. Could use numpy instead
data = [random.randint(0,10) for x in range(0,1000)]
 
# calling rplot 
robjects.r('dev.new()') # optional: create a new figure
rplot(robjects.FloatVector(data[:]), ylab="") 
 
 
# now, the histogram
robjects.r('dev.new()') # optional: create a new figure
rhist(robjects.FloatVector(data[:]), xlab="", main="user title")

The code is quite straightforward, however, note that you must use the ylab argument in rplot otherwise the ylabel is replaced by the data contents.

similarly, in the rhist, you must set xlab and the title using main

Posted in Python | Tagged , , | Leave a comment

ipython

If you start to use python, just install ipython to ease your life by having a more interactive python shell.

http://ipython.org/

A nice feature in the ability to embed matplotlib plot. Start with this option:

ipython qtconsole -pylab inline

Another great new tool is the notebook within a web interface a la mathematica/sage

ipython notebook
Posted in Python | 2 Comments

linux: How do I know the number of memory cards

The dmidecode command dumps lots of information about your system. The option memory gives you details about your memory card. In particular how many are installed (e.g., 2x2Gb or 1x 4Gb)

sudo dmidecode -t memory
Posted in Linux | Leave a comment

VIM: switch all text to lower case

You can change the case of a character by typing ~ , however, if you want to change all text to the same case (let us say lower case here), then you should enter the visual mode. Go to the line where you want to start. Here, we suppose we want to convert all text, so we go to the first line. You can type gg for instance. Then, type

    VGu
  • V turns on Visual selection, in line mode
  • G goes to end of file (at the moment you have whole text selected)
  • u lowercase selected area
Posted in Linux | Tagged | Leave a comment

How to embedded data files in python using setuptools

Within a Python package, it is useful to provide data files. These files are not python modules so you do not want to place same together with your module. Let us put them in a directory share/data. Suppose you have the following structure

.yourpackage
|– setup.py
|– share
|   |– data
|– src|
| `– yourpackage
|   |– __init__.py

Now, the setup file should include the directory share/data and its contents. There are different ways of doing it. We chose to save the share files within the distribution (not in a global share directory). The setup file should look like this:

#
#
#datadir = os.path.join('share','data')
#datafiles = [(datadir, [f for f in glob.glob(os.path.join(datadir, '*'))])]
 
# Based on Jeremy's comment,we can also us os.walk for recursion
datadir = os.path.join('share','data')
datafiles = [(d, [os.path.join(d,f) for f in files])
    for d, folders, files in os.walk(datadir)]


import metainfo # a file with relevant information
setup(
    name             = 'yourpackage',
    version          = metainfo.version,
    maintainer       = metainfo.maintainer,
    maintainer_email = metainfo.maintainer_email,
    author           = metainfo.authors,
    author_email     = metainfo.authors,
    description      = metainfo.description,
    keywords         = metainfo.keywords,
    long_description = metainfo.long_description,
 
    # package installation
    packages = find_packages('src'),
    package_dir  = package_dir,
 
    data_files = datafiles,
}

Then you could have a script to automatically generate the proper path name to any file in ./share/data

from os.path import join as pj
import yourpackage
 
def get_data(filename):
    packagedir = yourpackage.__path__[0]
    dirname = pj(os.path.dirname(packagedir), '..', 'share','data')
    fullname = os.path.join(dirname, filename)
    return fullname
Posted in Python | Tagged , | 8 Comments

HTML: How to redirect to another page

 
 <meta HTTP-EQUIV="REFRESH" content="0; url=http://whatever">

Note the syntax where content=”0; is not a typo. The content field contains both the URL to be redirect to and the delay (in seconds).

In general, you may want to provide a message and therefore a non=zro delay so tat the user can read any information you want to provide.

<html> 
<head>
 <meta HTTP-EQUIV="REFRESH" content="5; url=http://whatever">
 </head>
<body>
<p>You will be redirected to <a href="http://whatever">The RTools pypi link in  a few seconds.</a> Please update your bookmark.</p>
</body>
</html>
Posted in Computer Science | Tagged | Leave a comment

installing rpy2 with different R version already installed

The easiest way to install a python package is to use easy_install (or pip), so to install rpy2, type:


easy_install rpy2

To test that it is properly installed, type:


import rpy2;
from rpy2 import robjects; robjects.r("version")

If this code works, you should be able to import an existing R package. Yet, you may get this error:


Error in sub("[[:blank:]]*([[:alnum:]]+)", "\\1", dp) :
7 arguments passed to .Internal(sub) which requires 8
.
.
.
line 22, in RObjectMixin
__show = rpy2.rinterface.baseenv.get("show")
LookupError: 'show' not found

It took me a while to understand that this kind of error comes from the fact that rpy2 was compiled using a given R version, and that the current R version has changed (or is simply different). If you installed rpy2 while you were using R.2.10 and then you install R.2.11 then you will need to recompile rpy2 with the proper version.

To try out the following solution, you can use a virtual environment:


virtualenv testrpy2
cd testrpy2
source bin/activate
export PYTHONPATH=$PYTHONPATH:$VIRTUALENV/lib/python2.7/site-packages

Now, get the rpy2 source:


wget http://pypi.python.org/packages/source/r/rpy2/rpy2-2.2.4.tar.gz
tar xvfz rpy2-2.2.4.tar.gz

and compile it. You need to tell rpy2 what is the R version you want to link with

cd rpy2-2.2.4
export LDFLAGS="-Wl,-rpath,<path_to_R>/R-2.13.0/lib64/R/lib"
python setup.py build --r-home <path_to_R>/R-2.13.0/ install

rpy2 is installed with the proper R version, but you also need to use the proper version yourself:


export R_HOME=<path_to_R>/R-2.13.0/lib64/

Then, you can try again the python code above to import rpy2.

Not straightforward but this solution worked for me.

Posted in Computer Science, Linux, Python | Tagged , , , , | 8 Comments