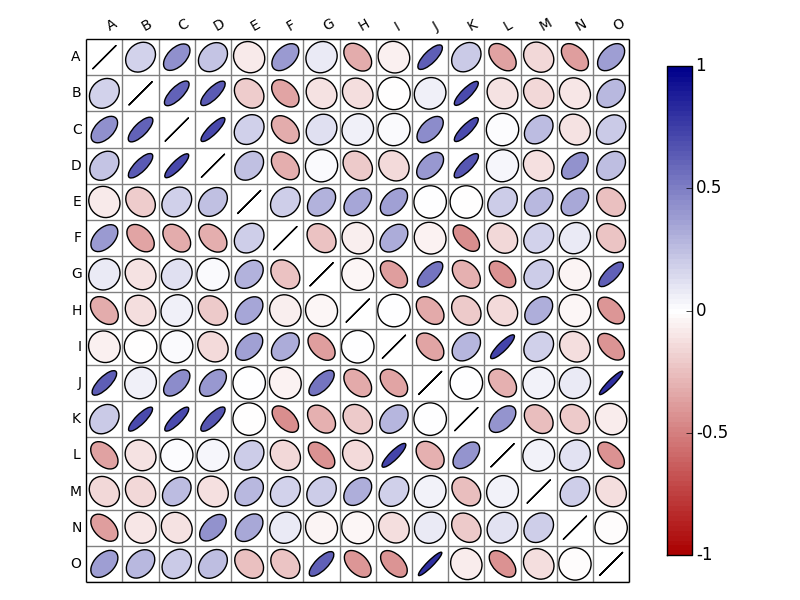
We’ve implemented a corrplot function in Python, which is available in BioKit package
– github https://github.com/biokit/biokit
– pypi https://pypi.python.org/pypi/biokit
For illustration, let us create some random data sets:
import pandas as pd import string letters = string.uppercase[0:15] df = pd.DataFrame(dict(( (k, np.random.random(10)+ord(k)-65) for k in letters))) df = df.corr() |
The correlation matrix is stored in the Pandas dataframe called df. It is now straightforward to create some nice plots:
from biokit.viz import corrplot c = corrplot.Corrplot(df) c.plot() |
See this notebook for more examples.
Please follow and like us:


4 Responses to corrplot function in Python