
matplotlib comes with lots of colormaps. First, let us see where and how to find them. Then, we will see how to extract individual colors (e.g., in RGB) from the colormap itself.
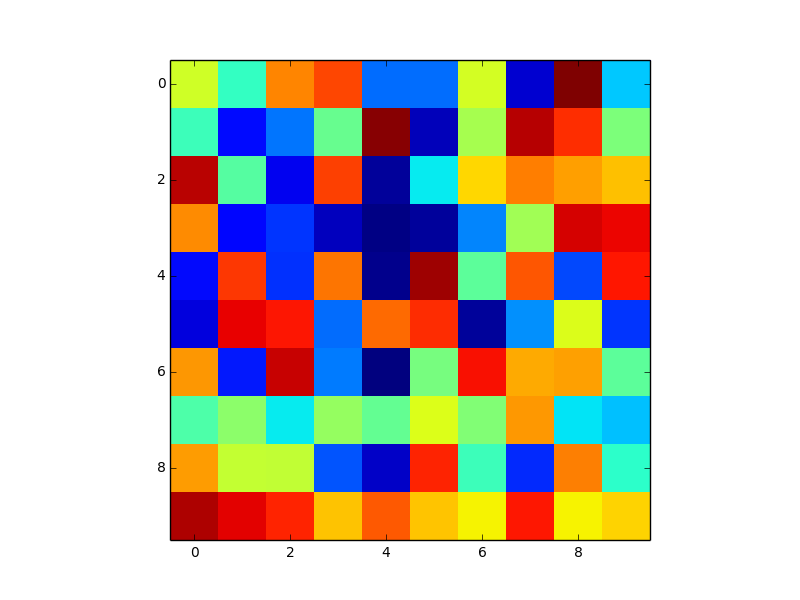
Let us first creat an image
from matplotlib import imshow import numpy as np imshow(np.random.rand(10,10)) |
By default, the jet colormap is used. You should see something like this
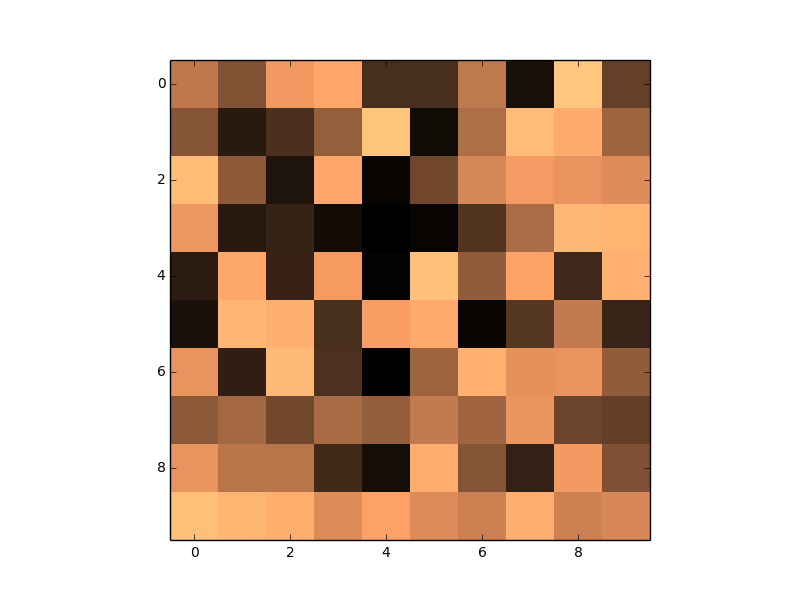
You can chnage the colormap easily but you need to know the name of the colormap first. Some colormaps are available as functions. For instance the copper one:
from matplotlib import imshow copper() |
How can we know the names of the colormap ? Check the documentation of colormaps itself for details or to obtain the full list of colormap names, type
from matplotlib import imshow colormaps() |
as mentionned above, some colormaps are available as functions. If not, you should use the function set_cmap:
from matplotlib import imshow from matplotlib import set_cmap set_cmap('copper') set_cmap('Accent') |
Finally, if you want to extract the color contained in a colormap, use the cm function:
from matplotlib import imshow >>> from matplotlib import cm >>> cm.jet(0) (0, 0, 0.5, 1) |
colormaps are usually encoded with N=256 colors. To figure out the first one, we use the code as above. If you want the latest one, use cm.jet(255)
Note that the returned objet is tuple of 4 items. The last one being the transparency.
One Response to About matplotlib colormap and how to get RGB values of the map