
If you have a matrix and want to plot its content as an image, matplotlib provides some functions such as imshow and pcolor.
c
Differences between imshow and pcolor
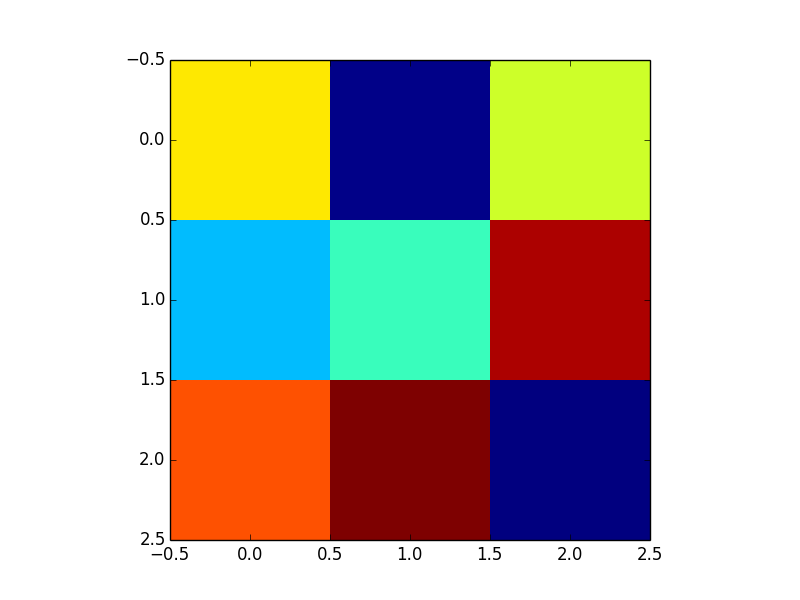
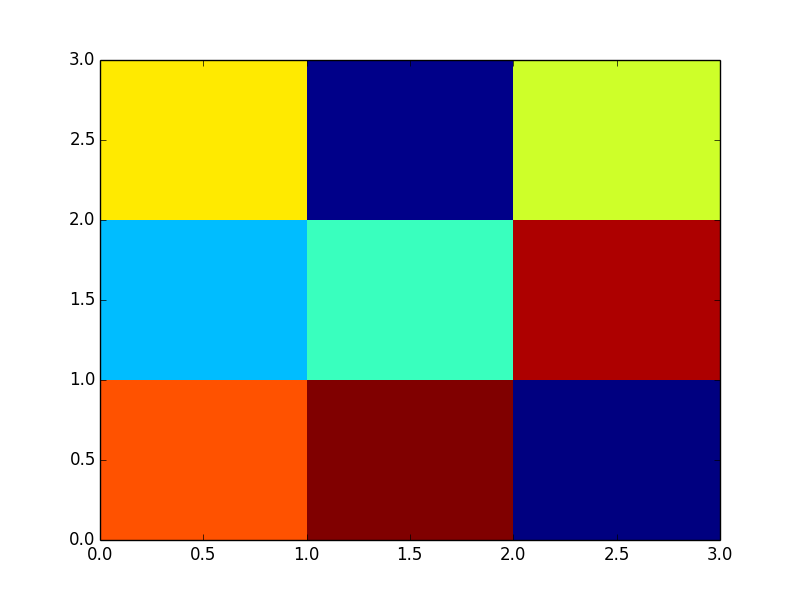
Let us use a simple 3 by 3 matrix and call imshow and pcolor.
from pylab import * data = random((3,3)) figure(1) imshow(data, interpolation='none') figure(2) pcolor(flipud(data)) |
Note the values of the data :
array([[ 0.72080244, 0.25576786, 0.67696279], [ 0.47049696, 0.54773236, 0.9342035 ], [ 0.83608481, 0.96395743, 0.24782517]]) |
Here are the figures; color code is: dark red=1, yellow=0.5, dark blue=0
So, the main differences are:
- imshow follows a convention used in image processing: the origin is in the top left corner. So the value 0.72 ( first row and first column in the matrix) appears in the top left corner. pcolor has a different convention; that is why we used the function flipud in the code above so that the two figures look similar.
- pixel locations are different as you can see on the x/y axis: placed at position 0,1,2 in imshow and between integer location in pcolor
- parameters used in the 2 functions are different and we let the reader look at the documentation for more details
- (update oct 2018). imshow function is also 4-5 times faster than pcolor (thanks to a comment from norok2) from matrices with dimension above 20-30. One can use the script here below to confirm this statement.
Differences between pcolor and pcolormesh
The 2 functions are almost identical. There are two main differences. The returned object differs: pcolor returns a class
`~matplotlib.collections.PolyCollection` but pcolormesh returns a class `~matplotlib.collections.QuadMesh`.
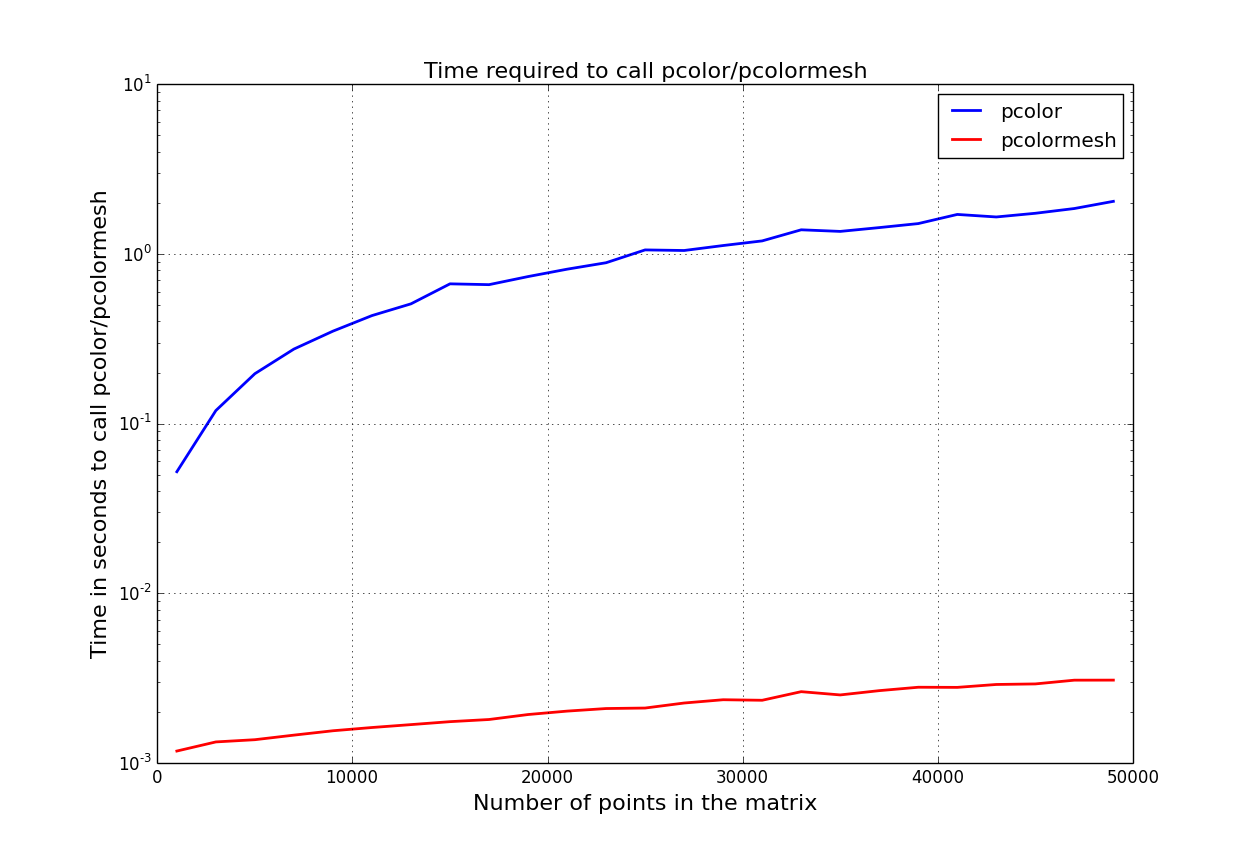
However, the main important difference is that pcolormesh is much faster by several order, as you can see in the figure below, which can be re-generated with the following code:
from pylab import * Tmesh = [] T = [] Xvector = range(10,500,20) # We one dimension of the matrix only, the other being fixed to 100 for N in Xvector: data = random((N, 100)) t1 = time.time() pcolor(data) t2=time.time() T.append(t2-t1) t1 = time.time() pcolormesh(data) t2=time.time() Tmesh.append(t2-t1) plot(Xvector, T, 'b', label="pcolor") plot(Xvector, Tmesh, 'r-', label="pcolormesh" ) |
As suggested by a few comments, the next question is why shall we use pcolor instead of pcolormesh ? From pcolormesh documentation, an additional difference is:
in pcolormesh *C* may be a masked array, but *X* and *Y* may not.
Masked array support is implemented via *cmap* and *norm*; in
contrast, :func:`~matplotlib.pyplot.pcolor` simply does not
draw quadrilaterals with masked colors or vertices.
Yet, I have not encoutered a case where pcolor should be used instead of pcolormesh.
Pingback: Python:matplotlib.pcolor very slow. alternatives? – IT Sprite
Pingback: Set Colorbar Range in matplotlib – PythonCharm
Pingback: Set Colorbar Range in matplotlib – inneka.com