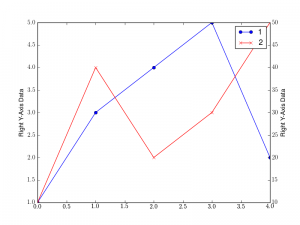
Sometimes, it is convenient to plot 2 data sets that have not the same range within the same plots. One will use the left y-axes and the other will use the right y-axis.
With matplotlib, you need to create subplots and share the xaxes. Here is a solution. This is not unique but seems to work with matplotlib 1.0.1
from pylab import figure, show, legend, ylabel # create the general figure fig1 = figure() # and the first axes using subplot populated with data ax1 = fig1.add_subplot(111) line1 = ax1.plot([1,3,4,5,2], 'o-') ylabel("Left Y-Axis Data") # now, the second axes that shares the x-axis with the ax1 ax2 = fig1.add_subplot(111, sharex=ax1, frameon=False) line2 = ax2.plot([10,40,20,30,50], 'xr-') ax2.yaxis.tick_right() ax2.yaxis.set_label_position("right") ylabel("Right Y-Axis Data") # for the legend, remember that we used two different axes so, we need # to build the legend manually legend((line1, line2), ("1", "2")) show() |
Please follow and like us:


Pingback: python multiple plot with subplot- different y axis same x asis – modelhelptokyo